McKinsey Says Advertising Is Moving From Attention to Action. Here Is What That Means at $2M a Year.
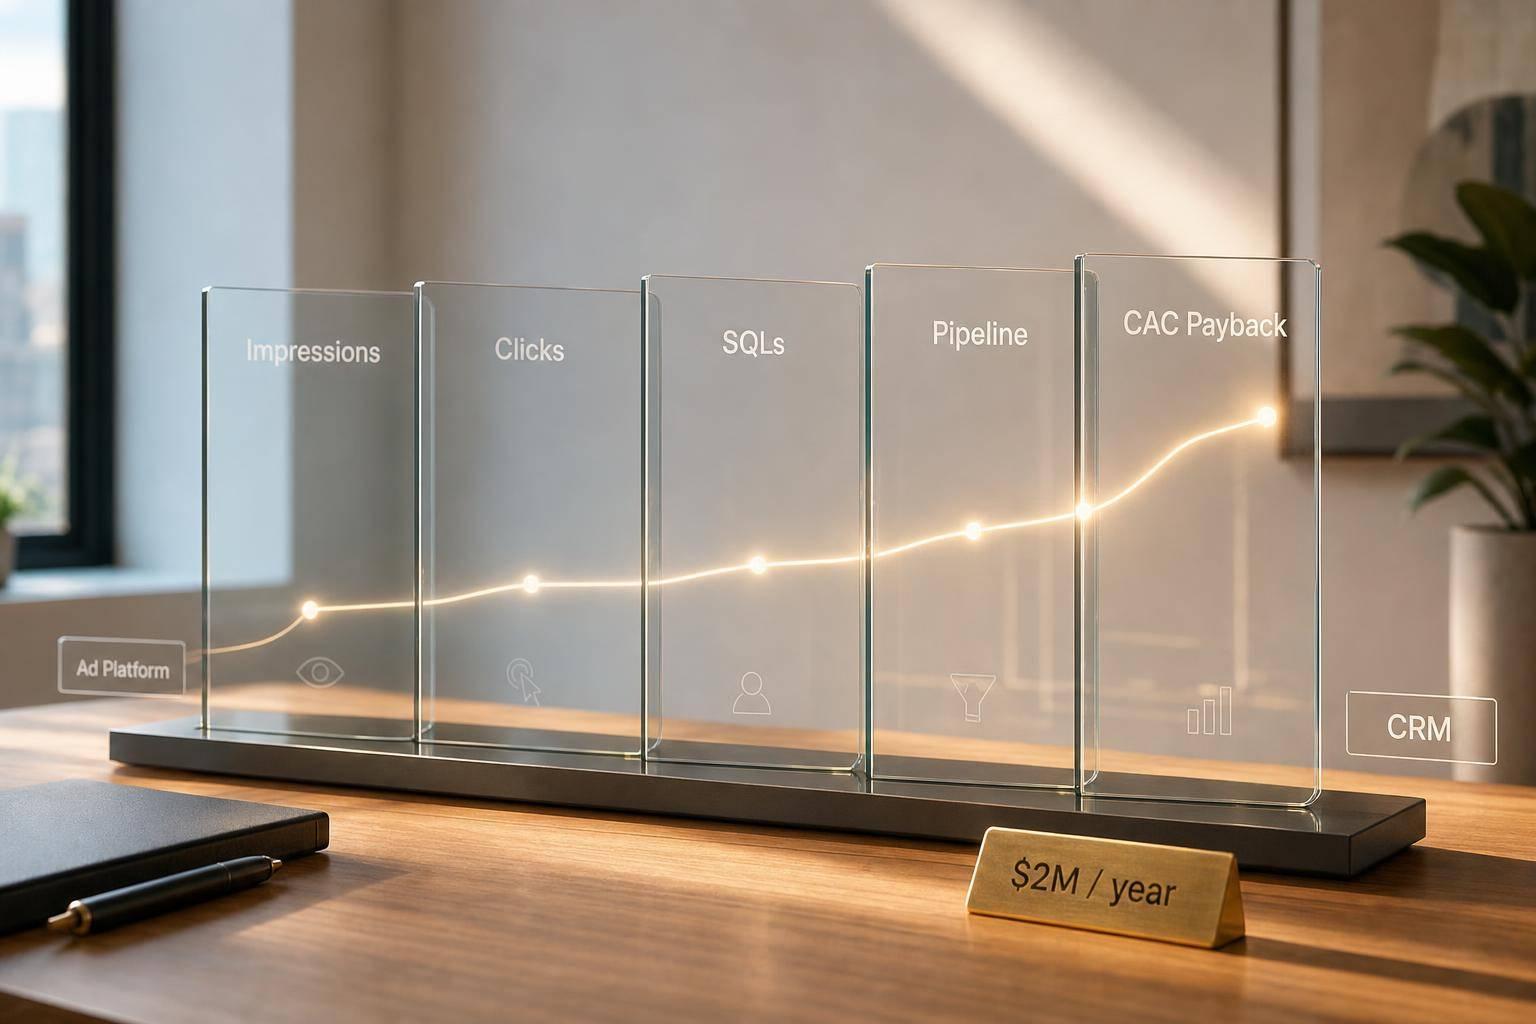
Here’s the short version: if your ads do not turn into pipeline, sales, and retained customers, the dashboard does not matter. For a business around $2,000,000 a year, the shift is simple: stop judging ads by clicks and reach, and start judging them by SQLs, opportunities, closed deals, CAC payback, and revenue per dollar spent.
I’d boil the article down to this:
- Clicks are weak signals. The article points out that CTR has only a very low link to pipeline.
- Lead volume can fool you. In B2B, under 1% of leads may turn into closed deals.
- Your CRM should run the score. Not Google Ads. Not Meta. Not LinkedIn.
- Offline conversion imports matter. If platforms optimize for low-quality form fills, they will keep finding more of them.
- Budget should move by sales impact. Shift spend based on cost per SQL, pipeline per $1, win rate by source, and marginal CAC.
- Retargeting and branded search often take too much credit. Use holdout tests to check what is adding net-new revenue.
- A clean monthly dashboard wins trust. Finance and sales want to see MER, CAC payback, qualified pipeline, win rate by source, and lift.
If I were running this at a small or mid-sized company, my rule would be: every campaign needs one clear job and one revenue-linked success metric. That means search should bring in intent, LinkedIn should reach target accounts, retargeting should move buyers forward, and email should help renewals and expansion.
A simple way to think about it:
| Area | What to watch |
|---|---|
| Search | Cost per SQL |
| LinkedIn/social | Qualified-account rate |
| Retargeting | Demo conversion rate |
| Email/lifecycle | Renewal rate and LTV |
| Whole program | MER, CAC payback, and pipeline created |
The main message is not hard: buy outcomes, not attention. Track what leads to money in the bank, feed those signals back into ad platforms, and cut anything that looks busy but does not help revenue.
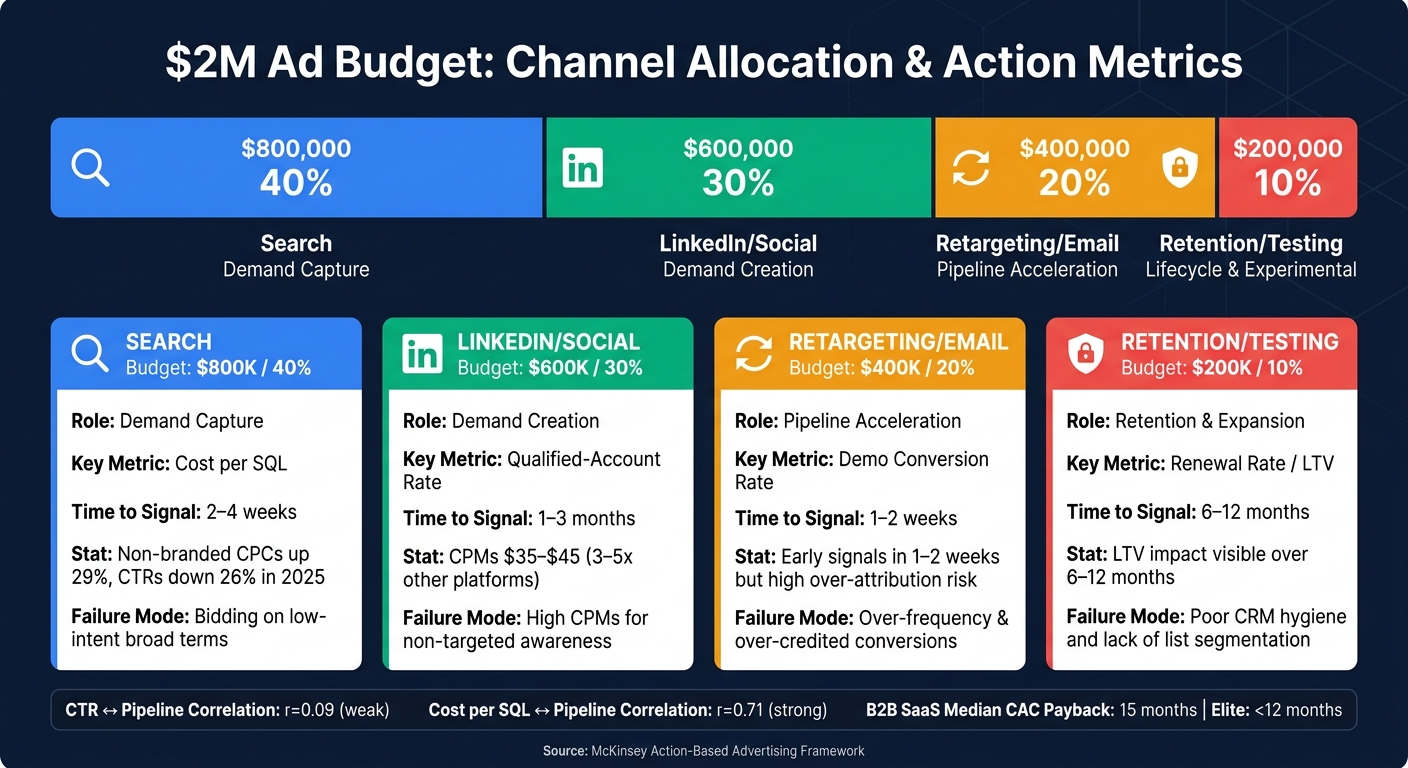
$2M Ad Budget Breakdown: Channels, Metrics & Action Goals
1. Redefine Success Around Pipeline, Revenue, and Retention
Map the Funnel in Action Terms
Map the funnel in revenue terms: visitor → lead → SQL → opportunity → closed-won → renewal/expansion.
Each stage needs a measurable action, not just a bigger number on a dashboard. The point is simple: did this step push revenue forward or not? That shift changes advertising from a media report into a revenue system.
Once the funnel is set up around actions, you can measure the stages that actually move revenue.
The Metrics That Matter at $2M a Year
At $2,000,000 a year, track marketing-sourced pipeline, cost per SQL, cost per opportunity, demo show rate, CAC payback, and pipeline per $1 spent. Those are the numbers that should shape budget calls. At this stage, one bad channel can throw off the whole quarter, so your scorecard needs to show revenue impact fast.
Click-through rate correlates with pipeline at only r=0.09, while cost per SQL correlates at r=0.71 [8]. In plain English, clicks are a weak stand-in for revenue.
CAC payback = CAC ÷ gross profit per account. The median for B2B SaaS sits at 15 months; elite operators hit sub-12 months [1]. That benchmark shows whether your acquisition model can hold up.
These metrics keep the business accountable without wiping out brand work that shapes later-stage demand.
How to Keep Brand Awareness Without Losing Accountability
Brand awareness still matters. But it needs to show downstream impact.
The issue isn't awareness itself. It's awareness with no proof that it changed anything. Use pipeline velocity to test whether brand spend shortens sales cycles or lifts win rates. Add a "How did you hear about us?" field to demo forms so you can pick up dark-funnel influence. Self-reported attribution isn't perfect, but it helps close the gap between what your CRM records and what actually shaped the deal. Use it to guide channel choices, not as a substitute for CRM data.
Awareness should keep budget only when it improves conversion, sales speed, or retention. If it doesn't change pipeline velocity, deal size, or retention, it's hard to defend.
That gives you the scorecard. The next move is deciding where each dollar should go.
sbb-itb-9cd970b
Which Metrics ACTUALLY Matter for B2B Marketers with Ray Rike - Ep 22
2. Reallocate a $2M Budget Toward Channels That Drive Action
With the scorecard in place, the next step is simple: decide where each dollar goes.
A Simple Budget Model for $2,000,000 a Year
This model assumes $2 million in annual media spend. If your business runs on $2 million in revenue, just scale these percentages to fit your ad budget.
For a team spending the full $2 million on paid media, the split below is a solid starting point, not a rulebook. Think of it as a working hypothesis you review every month.[12]
| Budget Category | Annual Allocation | % of Total | Primary Goal |
|---|---|---|---|
| Demand Capture (Search) | $800,000 | 40% | Intercept active buyers |
| Demand Creation (LinkedIn/Social) | $600,000 | 30% | Reach the 95% not yet in-market [11] |
| Pipeline Acceleration (Retargeting/Email) | $400,000 | 20% | Move leads to demos or purchases |
| Retention/Testing (Lifecycle/Experimental) | $200,000 | 10% | Support renewals and test new channels |
Hold back 10% for testing so your spend doesn’t get stuck on whatever happened to win last quarter.
What Each Channel Should Do: Search, LinkedIn, Retargeting, Email, and Lifecycle
Each channel has one main job. When teams blur those jobs together, that’s usually where a $2 million budget starts leaking money.
Search is your demand capture engine. Non-branded search CPCs went up 29% in 2025, while CTRs dropped 26%, so loose keyword targeting now costs more and gives back less.[8] Search should earn its budget by driving SQLs at a cost you can defend, not by piling up form fills that never turn into revenue.
LinkedIn is expensive. CPMs sit around $35 to $45, or about 3 to 5 times higher than most platforms.[12] That price only works if you’re building familiarity with decision-makers who aren’t searching yet. If you use it like a cheap traffic source, it’ll eat budget fast.
Retargeting brings back site visitors and mid-funnel leads. It moves fast, with early signals in 1 to 2 weeks, which is why teams like it.[5][3] But there’s a catch: it’s also the channel most likely to claim credit for conversions that would have happened anyway.
Email and lifecycle make up your revenue layer after the first touch. They usually take the longest to show up in the numbers, often 6 to 12 months if you’re looking at LTV impact, but they help protect revenue you already worked hard to win.[2][11] The weak spot here is usually bad CRM hygiene. If your lists are stale or your segments are messy, automation just sends the wrong message to the wrong person, faster.
How to Decide When to Kill, Scale, or Test a Campaign
Use cost per SQL, pipeline per dollar, win rate by source, and marginal CAC to decide whether a campaign should be killed, scaled, or tested further.
In plain English, that means looking at cross-channel results every 30 days and shifting 5% to 15% of budget from the weakest performer to the strongest.[12] Don’t scale any one channel by more than 20% per month. That gives the algorithm time to find more responsive users instead of falling apart under a sudden jump in spend.[12]
| Channel | Primary Role | Best Action Metric | Time to Signal | Common Failure Mode |
|---|---|---|---|---|
| Search | Demand Capture | Cost per SQL | 2–4 weeks | Bidding on low-intent broad terms [10][12] |
| Demand Creation | Qualified-account rate | 1–3 months | High CPMs for non-targeted awareness [12] | |
| Retargeting | Pipeline Acceleration | Demo Conversion Rate | 1–2 weeks | Over-frequency and over-credited conversions [5][3] |
| Email/Lifecycle | Retention & Expansion | Renewal Rate / LTV | 6–12 months | Poor data hygiene and lack of CRM sync [2][11] |
One B2B SaaS team made this shift in a very direct way. They changed Google Ads optimization from "Demo Requests" to "SQL Created" using HubSpot offline conversion imports, rebuilt campaigns around ICP-intent keywords, and added qualification fields to landing pages.[10] Within 60 days, demo volume dropped 33%, but the demo-to-SQL ratio and pipeline value went up. That’s the point: change what the algorithm is trying to get you.
Once the mix is in place, the next move is tying spend back to CRM data, attribution, and automation.
3. Build a Stack for Attribution, Conversion, and Automation
Moving from attention to action isn't just a shift in strategy. It's a shift in plumbing.
If your ad spend isn't tied back to CRM and revenue data, you're still guessing. And that means the budget model from section 2 stays a spreadsheet exercise instead of becoming something you can track.
Use CRM and Attribution as Your System of Record
Your CRM should be the place where the truth lives. Every campaign touch, form fill, meeting booked, and closed deal should end up there. For a $2 million business, HubSpot or Salesforce can keep campaign, pipeline, and revenue data tied together [14].
The big move here is Offline Conversion Imports (OCI). Feed CRM conversion data back into Google and Meta so their algorithms can optimize for revenue, not cheap form fills [13][15]. Demo requests matter, but they should be treated as secondary. The main goal is to optimize for SQLs and Closed-Won events [13][17].
That matters because Smart Bidding can only work with the signal you give it. If you feed it low-intent conversions, it'll chase more of those. If you feed it CRM-based revenue signals, it starts learning what a good customer looks like.
Once those revenue signals flow back into the ad platforms, performance starts to show up in the CRM instead of living only inside ad dashboards.
For attribution, W-shaped attribution is a strong fit for mid-market B2B companies with 90-180 day sales cycles. It assigns 30% credit to first touch, 30% to MQL conversion, 30% to opportunity creation, and spreads the last 10% across the middle touches [7]. That's a lot less skewed than last-click attribution, which can overstate paid search by 2x and understate content marketing by 3x [17].
Browser pixels still help, but they now miss 20% to 40% of conversion events in 2026 because of privacy changes and ad blockers [16]. Server-side tools like Meta's Conversions API and Google Enhanced Conversions help fill that gap. If both fire, use a shared event_id so you don't double-count conversions [16].
SaaS and AI Tools That Improve Conversion and Reporting
Build a stack that stays connected and easy to check. At a minimum, it should link four layers: paid channel data, behavioral data in GA4, pipeline data in the CRM, and revenue data in Stripe or your billing system [14].
A shared customer identifier, usually an email address or account ID, needs to carry across those layers. If it doesn't, your team ends up stitching reports together by hand. That's slow, messy, and easy to get wrong.
| Category | Representative Tools | Primary Action Metric | Key Integration Requirement |
|---|---|---|---|
| CRM | HubSpot, Salesforce | Pipeline Stage (SQL/Opp) | Bi-directional sync with ad platforms |
| Marketing Automation | HubSpot, Marketo | Lead-to-SQL Velocity | UTM capture on all forms |
| Attribution (MTA) | Dreamdata, HockeyStack | Multi-touch Revenue Credit | Identity resolution (email/account ID) |
| Server-Side Tracking | LeadJourney, SaasDash | Event Match Quality (EMQ) | Server-to-server API |
| Analytics | GA4, Prooflytics | Cost per SQL / ROAS | Shared customer identifier across layers |
A good example came in April 2026. PriceLabs connected Google Ads and LinkedIn Ads to their HubSpot CRM with GrowthSpree's MCP (Model Context Protocol). Once they shifted optimization from lead volume to pipeline value, ROAS moved from 0.7x to 2.5x, which was a 350% improvement [6].
Automate the Handoff From Lead to Revenue
One of the easiest ways to lose a high-intent lead is to move too slowly after conversion.
This is where automation helps. Let the system handle the repeatable steps so sales can spend time on the calls and emails that move deals forward.
A few workflows are worth setting up:
- Instant lead routing: Capture GCLID, FBCLID, or MSCLKID in hidden fields, then use a CRM webhook to route the lead and update the record. Make can send these stage-change webhooks within 60 seconds [15][17][18].
- AI-drafted follow-up emails and task prompts: If a lead ignores the first outreach, automated sequences can keep the thread alive without adding manual work for the sales team.
- CRM-fed retargeting audiences: Sync CRM pipeline stages with ad platform audiences so you can serve "Request a Demo" ads to contacts in the MQL stage [15].
- Pipeline stage webhooks: Trigger CRM webhooks when a lead becomes "Qualified" or "Closed-Won" so ad platforms get fresh conversion data and stop chasing low-value signals [15][18].
Once the stack is wired together, you can run campaigns against those signals and report on revenue instead of platform-reported conversions.
4. Run Campaigns, Track Attribution, and Report on What Matters
Once CRM, attribution, and automation are set up, the job shifts from tracking activity to driving pipeline and tying it to revenue. That means picking campaigns that send clean signals back into the business.
Example Campaigns an Action-Based Team Can Run
Start with high-intent search. Split branded and generic campaigns so branded traffic doesn't hide weak new-demand performance [9].
Then add competitor conquesting for buyers who are already looking at other options. Keep the focus on three intent buckets: pricing, problem or complaint, and review or validation [20]. You can also layer in comparison terms and category-level research queries so buyers can build a shortlist [9].
Retarget pricing-page visitors with ads that answer the pricing objection directly. If someone's already on the pricing page, they're not looking for a long brand story. They want a clear reason to move forward.
Lifecycle email also helps protect renewals and expansion. Use CRM data to trigger sequences for:
- Customers getting close to renewal
- Users who haven't touched a key feature
- Accounts that match an expansion profile
One thing matters across all of these campaigns: use holdout tests, not just platform conversion counts.
Measure Incrementality, Not Just Platform-Reported Conversions
Here's why that matters. In one documented example, a platform reported 930 conversions while the actual number tied to net-new revenue was 420 [4]. That's not a small gap. It's the kind of gap that can push a team to spend money in the wrong place.
Holdout tests help you measure incrementality. Pause spend in one geography or audience segment, leave everything else alone, and compare the results with a control group. If pipeline drops in the paused region and stays steady in the control, the spend was doing its job. If nothing changes, that channel was mostly taking credit for customers who likely would have converted anyway.
Branded search often looks great inside ad platforms but much weaker in holdout tests. So report branded search on its own, and don't use it to defend the full budget.
That's the bar your dashboard should meet every month.
Build a Monthly Revenue Dashboard the CFO and CRO Will Trust
A revenue dashboard should answer one plain question: is this spend creating net-new revenue at an acceptable cost?
Only report the metrics that shape budget calls. And each metric needs a clear owner and a set reporting cadence.
| Dashboard Metric | Owner | Reporting Cadence | Business Decision Supported |
|---|---|---|---|
| Marketing Efficiency Ratio (MER) | CMO / CFO | Monthly | Overall efficiency and budget size [4] |
| CAC Payback Period | CFO / CMO | Monthly | Checks unit economics [20] |
| Qualified Pipeline | CRO / VP Sales | Weekly | Guides sales capacity and forecast accuracy [19] |
| Win Rate by Source | RevOps | Quarterly | Shows which channels produce the best deals [19] |
| Incremental Lift (Holdout Results) | Data Science | Quarterly | Shows whether a channel drives net-new revenue or only claims credit [7][1] |
Use CAC payback as the main control metric. If it misses target for two straight months, cut spend by 20% or pause the campaign. If ROAS is above 4:1 and volume still holds, increase spend by 10% to 20% and review again in 30 days [21].
MER = total revenue ÷ total marketing spend. It gives the CEO and CFO one portfolio-level efficiency check that's harder to game than any single platform's reported ROAS [4].
Conclusion: Stop Buying Attention and Start Buying Outcomes
Once the stack and reporting are set up, the next question gets simple: is ad spend turning into revenue? Every dollar should connect to a sales call, an opportunity, or a closed deal.
At a $2M budget level, that means getting clear on action metrics, shifting budget into channels you can hold accountable, automating lead-to-revenue handoffs, and checking spend with incrementality instead of trusting platform-reported conversions. Optimize for revenue, not easy platform proxies. When you do that, the budget gets managed by pipeline, not dashboard vanity metrics.
Platform-reported revenue can exceed actual revenue by roughly 77%, so the distance between what a dashboard says and what hits the bank account can be huge [22]. Importing SQL and Closed-Won data from HubSpot, then switching Smart Bidding to optimize for pipeline value instead of cheap form fills, led to higher pipeline contribution even with a 33% drop in total lead volume [13].
Marginal CAC tells you whether the next dollar is worth it. Blended CAC shows how the whole system is doing. The CFO trusts marginal CAC, the CRO trusts pipeline, and the business buys outcomes. That’s how a $2M ad budget buys revenue instead of reach.
FAQs
How do I know if my ads are driving real revenue?
You know your ads are driving actual revenue when ad spend is tied to closed-won revenue in your CRM, not stand-in metrics like clicks, impressions, or demo requests. Put plainly: platform dashboards alone aren't a reliable source of truth.
To verify performance, connect your CRM to ad platforms and send back deep-funnel milestones. Then layer in measurement from a few angles, like MMM, geo-holdout tests, and MER. It also helps to add self-reported attribution so you can pick up dark-funnel influence that platform data often misses.
Which metrics should a $2M business track instead of clicks?
Track revenue-based metrics tied to actual sales, not just media consumption.
Focus on metrics like:
- Pipeline velocity
- Marketing efficiency ratio (MER)
- Incremental ROAS (iROAS)
- Cost per pipeline dollar
- Conversion rates by milestone, such as MQL-to-SQL and SQL-to-Closed-Won
Connecting your CRM to ad platforms also helps you optimize for deeper-funnel milestones instead of clicks.
What tools do I need to connect ad spend to pipeline and sales?
You need one setup that ties together your ad platforms, web analytics, and CRM.
- Standardize UTM parameters across every channel
- Use Meta CAPI and Google offline conversion tracking to send CRM milestones back to ad platforms
- Make sure form submissions capture UTM data and sync to HubSpot or Salesforce
- Report in Looker Studio or an attribution platform, then optimize for CRM-verified pipeline and sales
This matters because ad platforms can only tell part of the story on their own. If your data lives in separate places, it's hard to know which campaigns are driving actual revenue and which ones just look good on the surface.