What Is a Good Revenue per Employee for a Marketing Agency?

I use $150,000–$200,000 in annual revenue per full-time equivalent (FTE) as a healthy starting range for marketing agencies, with $200,000–$300,000 as strong. I calculate it using the past 12 months of agency gross income (AGI), excluding pass-through costs, divided by average FTEs, including working owners and recurring contractors.
But a high ratio is not proof of spare capacity. I check margins, client retention, and workload before I call it a win.
For agencies doing $2 million–$10 million a year, I focus on 3 questions:
- Is the math fair? Remove media spend and other pass-through costs. Count the people doing the work.
- Is the team stretched? Check pricing, scope, and rework. Sustained utilization above 85% is a warning.
- Is missing context slowing delivery? Fix repeated briefs and approval delays before adding staff.
<u>AI is not always the limit. Missing client context can be.</u> Portable Delivery Intelligence connects client strategy and rules to AI tools so repeat client work can run with human review.
Agile Growth Labs (AGL) targets 18–25 accounts per account manager, compared with 4–8. I treat that as a target to test, not proof that your team can take on more work today.
- Run the free Capacity Leak Calculator to see how many more accounts your team could carry.
- Want help? Bring 1 client account to a free mapping session.
Revenue Per Employee: Did AI Actually Make You Money?
sbb-itb-9cd970b
How to Calculate Revenue per FTE
Revenue per FTE = trailing 12-month net service revenue ÷ average full-time equivalents (FTEs) over those same 12 months. Use this ratio to compare delivery capacity on equal terms, rather than raw billings, since pass-through costs and how you count staff can change what the number tells you. [1][3][4]
Add your 12 month-end FTE counts, then divide by 12. Keep a written record of revenue exclusions and staffing assumptions. Use the same rules each year so your comparisons hold up. [1][3][4]
Count Employees, Working Owners, and Contractors
Count all paid labor, not just the people who do client work. Include working owners, executives, and non-billable admin staff. On a 40-hour schedule, an employee who works 20 hours per week counts as 0.5 FTE. [1][3][5]
If a founder does billable work without a market-rate salary, assign market-rate pay to that work when you assess margins. Otherwise, unpaid founder labor can make margins look better than they are. [1][3][5]
Report payroll-only and expanded workforce ratios separately. Choose a consistent rule for each. Include recurring contractors in the FTE count, but do not subtract their costs from revenue. For pass-through specialists billed to the client, subtract their cost from revenue and leave their hours out of the FTE count. [1][4][7]
Separate Gross Billings from Net Service Revenue
Gross billings are the total amounts invoiced. That total may differ from revenue in your books. If your books already leave out pass-through costs, do not subtract them again. [1][2][3]
Net service revenue leaves out pass-through costs, but it is not profit. You still need to pay salaries, retained contractor costs, and overhead. [1][2][3]
Record every pass-through exclusion. These may include media, printing, production, freelancers, software, licenses, and reimbursed travel. Use net service revenue per FTE for comparisons when these costs make a large difference. [1][2][3]
Measure Calculation Result Gross billings per employee FTE $3,000,000 ÷ 16 $187,500 per FTE Media pass-through excluded $800,000 removed from billings $2,200,000 net service revenue Net service revenue per employee FTE ($3,000,000 − $800,000) ÷ 16 $137,500 per FTE Example uses 16 employee FTEs and excludes contractors. [8]
Account for Differences in Service Mix
Compare agencies that do similar work and count contractors the same way. Pricing based on expertise can increase revenue per FTE without adding hours. Custom production and development may need more labor. [6][7][8]
A lower ratio can still support healthy margins if delivery costs are lower. Check the ratio alongside a metric that fits the work. [6][7][8]
| Service model | What can skew the ratio | Delivery-cost consideration | Companion metric |
|---|---|---|---|
| Strategy & advisory | Expertise pricing increases revenue per FTE | Senior talent costs more | Gross margin |
| Paid media | Media pass-throughs inflate billings | Separate agency labor and tools from ad spend | AGI per FTE |
| Design & production | Project work creates peaks and valleys | Freelance and production labor vary by project | Realization rate |
| SEO & content | Labor-heavy work can lower the ratio | Include recurring specialist capacity | Utilization rate |
| Development | Hourly pricing limits revenue | Technical salaries and delivery hours matter | Effective hourly rate |
The same revenue per FTE can reflect efficient delivery at 1 agency and an overloaded team at another. Check revenue exclusions, staff counts, and service mix before deciding what your number means.
Agency Examples: Efficiency, Overload, and Inflated Ratios
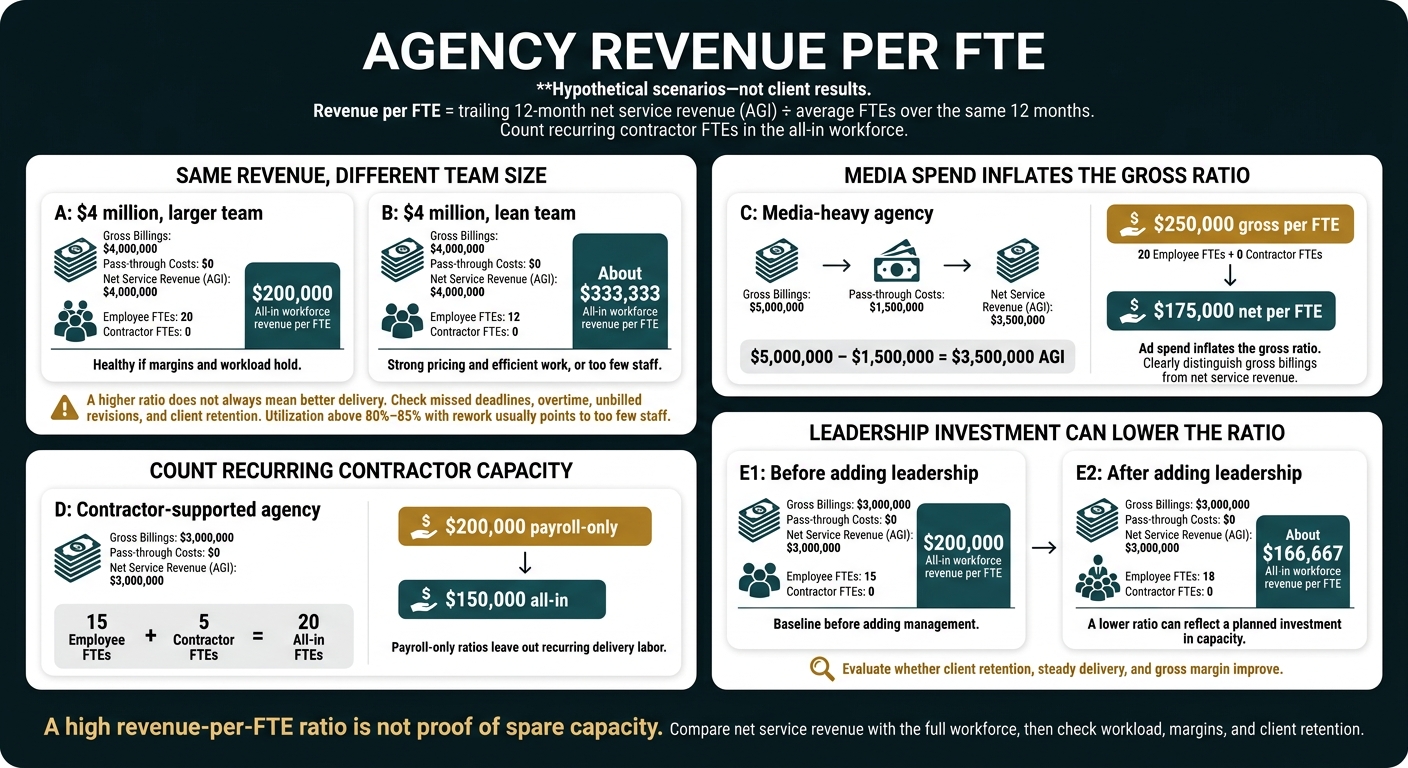
Agency Revenue per FTE: What the Numbers Really Mean
A high revenue-per-FTE ratio can reflect good pricing and efficient work, but it can also hide ad spend, contractor labor, or an overloaded team. Compare net service revenue with the full workforce, then check workload, margins, and client retention before treating a higher ratio as a win.
Use trailing-12-month AGI and average FTEs. Apply the same contractor rule as above.[1][7]
These examples show how the same ratio can tell different stories.
Hypothetical scenarios - not client results
Scenario Gross billings Pass-through costs Net service revenue (AGI) Employee FTEs Contractor FTEs Revenue per FTE: Payroll-only Revenue per FTE: All-in workforce What it means A: $4 million, larger team $4,000,000 $0 $4,000,000 20 0 $200,000 $200,000 Healthy if margins and workload hold B: $4 million, lean team $4,000,000 $0 $4,000,000 12 0 About $333,333 About $333,333 Strong pricing and efficient work, or too few staff C: Media-heavy agency $5,000,000 $1,500,000 $3,500,000 20 0 $250,000 gross; $175,000 net $175,000 net Ad spend inflates the gross ratio D: Contractor-supported agency $3,000,000 $0 $3,000,000 15 5 $200,000 $150,000 Payroll-only ratios leave out recurring delivery labor E1: Before adding leadership $3,000,000 $0 $3,000,000 15 0 $200,000 $200,000 Baseline before adding management E2: After adding leadership $3,000,000 $0 $3,000,000 18 0 About $166,667 About $166,667 A lower ratio can reflect a planned investment in capacity
$4 Million Agencies: Efficient Delivery or Understaffing?
A higher ratio does not always mean better delivery. Agency A’s $200,000 ratio fits the healthy range, but you still need to check whether the team has room to work or feels stretched.
Agency B’s ratio is higher. Check missed deadlines, overtime, unbilled revisions, and client retention before calling it better. Utilization above 80%–85% with rework usually points to too few staff, not more efficient work.[2][10]
How Media Spend and Contractors Change the Ratio
Ad spend and contractor labor can make payroll-only ratios look better than they are. Agency C’s billings include media spend, which overstates revenue from agency work. Its $250,000 gross ratio falls to $175,000 net.[1][7]
Agency D leaves 5 recurring contractor FTEs out of its payroll-only ratio. Count them, and revenue per FTE falls from $200,000 to $150,000.[1][7]
Why Leadership Hires Can Lower Revenue per FTE
Leadership hires can lower the ratio without making the agency less productive. Agency E adds account leadership and operations staff while service revenue stays flat. Its ratio falls from $200,000 to about $166,667.
That drop can reflect a planned investment, not a failure. A lower ratio is fine if client retention, steady delivery, and gross margin improve.[5][7][9]
Use these patterns to decide whether to add capacity, fix pricing, or hire.
When to Improve Capacity and When to Hire
Improve capacity before hiring when repeat coordination work slows delivery and the team still has room to do the work. Hire when a lasting gap in a specific role remains after workflow fixes, and signed client work can cover the full cost at your target margin.
Find the Bottleneck Behind the Number
Use the benchmarks above to find what limits growth: demand, pricing, workflow, or staffing.
Revenue per FTE is a signal to check, not a signal to hire. Use AGI and the same rules for available and billable hours each period.[2] Track utilization and realization alongside revenue per FTE.
| Observed pattern | Likely issue | Next action |
|---|---|---|
| Low revenue per FTE, low utilization | Weak demand or stalled work | Check the pipeline and approval delays |
| Low revenue per FTE, high utilization | Pricing, scope, or role mix | Fix pricing, scope, or role mix |
| High revenue per FTE, falling quality | Overload | Cut the load or add capacity |
| Pass-through distortion | Inflated billings | Base the decision on AGI |
| Workflow bottleneck | Repeated coordination work | Test workflow changes before hiring |
| Role-specific shortage | A staffing gap | Hire based on signed contracts and full employment cost |
Check client retention, client concentration, workload, and signed demand. Hire only when the gap will last and the work can support the role at your target margin. A new hire can lower revenue per FTE for a time before output catches up.[7]
More staff won't fix missing context. If the team spends its time finding client rules, repeating briefs, or chasing approvals, fix that workflow first.
Handle More Clients Without Overloading the Team
Measure hours by role and service complexity, not just client count. That applies even when account managers carry 4–8 accounts.
Check time spent on brief changes, lost context, approval delays, and rework. More accounts help only if the delivery team has room, too.
1. Test 1 recurring service.
Set shared rules for the service and keep human review. Compare hours per account and delivery margin before and during the test.
2. Check whether the time savings hold.
Add more work only if revisions, missed deadlines, and overtime do not rise. If hours per account do not fall, fix the remaining constraint first. Human capacity is still the limit.
Where Portable Delivery Intelligence Fits
Test automation before hiring when repeat coordination work is the bottleneck.
Portable Delivery Intelligence connects client strategy and rules to AI tools so recurring client work can run with human review. Agile Growth Labs (AGL) uses it with tools such as ChatGPT, Claude, and Gemini.
The AGL capacity target is 18–25 accounts per account manager, compared with the 4–8 account cap. Treat that as a target, not proof that your team has room today.
Use Portable Delivery Intelligence only when you can standardize repeat work without moving the bottleneck to strategy, production, or approvals. If a gap in a specific role remains, hire.
Conclusion: Use Revenue per FTE to Plan Growth
For most agencies, $150,000–$200,000 in annual revenue per FTE is a healthy starting range, not a target for every agency. Use it to plan growth, but account for your service mix, pricing, and staffing before you decide what your team can support.[4][8]
For an apples-to-apples comparison, use trailing 12-month AGI per average FTE. Keep the same counting rules each time.[1][2][4][7]
Read the ratio as a capacity signal, not a score. Check it alongside gross margin, net margin, delivery quality, client retention, and workload.[2][4][7][8]
Remove delivery friction when it limits what your team can carry. Hire when signed demand exceeds measured capacity. Aim for growth your team can support and healthy margins, not the highest ratio.[2][4][7][8]
FAQs
How do I set a revenue-per-FTE target for my agency?
Divide your trailing 12-month revenue by your average full-time equivalents (FTEs). Count contractors as fractional FTEs based on hours worked. If pass-through costs inflate revenue, use Agency Gross Income (AGI) per FTE instead.
Use $180,000+ for generalists and $250,000+ for specialists as benchmarks to check your agency’s health, not fixed goals. A ratio below $120,000 signals structural risk. Check pricing, utilization, or overstaffing before you hire.
Track this ratio alongside margin and capacity. Don’t use it alone to make hiring calls.
How do I factor seasonality into staffing decisions?
Track revenue per employee over a trailing window, not just the current quarter. New hires count right away, but the revenue they help bring in may arrive 2–3 quarters later [1].
Use the same formula each time: AGI (gross revenue minus pass-through) ÷ full-time equivalents (FTEs). Compare each quarter with its trailing 3-month average. Check any shift over 10% to learn what changed [2].
Plan staffing around confirmed contracts and the odds that pipeline deals will close, not forecasts alone. Use seasonal demand to schedule team capacity [1].
How can I verify that AI saves capacity without hurting margins?
Track AGI per FTE each quarter, along with utilization by role and operating margin. With headcount flat, AGI per FTE should grow or hold steady. Margins should improve as delivery costs fall.
If AGI per FTE drops or margins shrink, check for savings that have not reached the bottom line or more staff than the work needs.
Before hiring, check whether your AI-supported team can take on more work. Portable Delivery Intelligence helps you tell the difference between more billable output and added internal work you cannot bill.