What Is a Good Profit Margin for a Marketing Agency? Where Delivery Eats It

For a marketing agency, I use 50%+ gross margin, 20%–30% operating margin, and 15%–25% net margin as planning targets, measured against fee income, not total billings. Before hiring or changing prices, I check each account’s actual delivery costs, including account management, senior review, and unpaid revisions.
The gap is often in how work gets done. AI can draft the work, but people still spend time rebuilding briefs, finding client details, and chasing approvals. I check those hours before blaming the tool or the fee.
My rule: <u>count the full cost of delivery before choosing the fix.</u>
- Track profit by account, not just across the agency.
- Separate unpaid extra work from time spent on coordination.
- Test clearer briefs and approval rules for 60–90 days.
- Count saved time as capacity, not profit, until costs fall or profitable revenue grows.
How to make your marketing agency more profitable (margins, pricing & ops)
sbb-itb-9cd970b
Where Client Delivery Cuts Account Profit
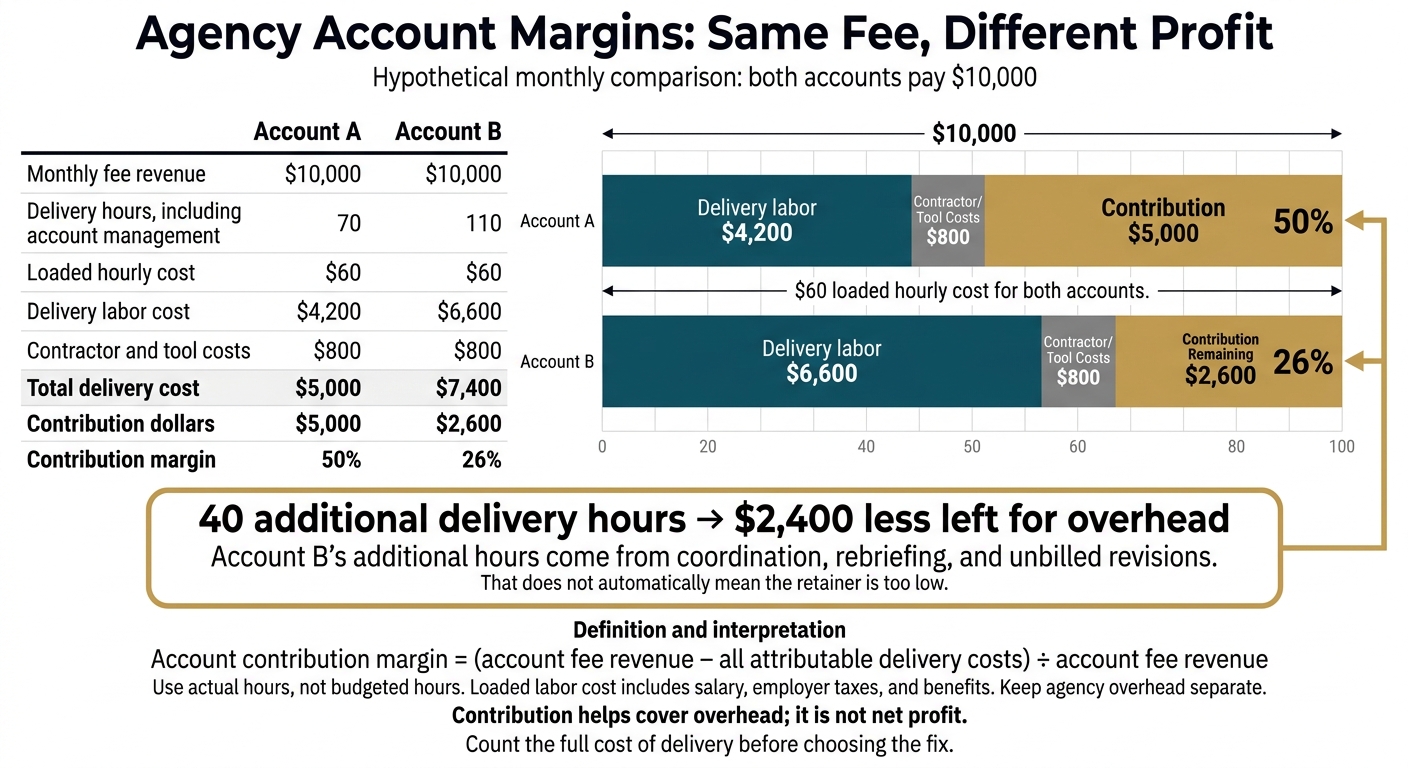
Agency Account Margins: Same Fee, Different Profit
Client delivery cuts account profit when the work costs more than the fee leaves room for, even if agency-wide margins look healthy. Measure profit by account using actual delivery hours, since 2 clients paying the same fee can leave very different amounts to cover overhead.[6][7]
Calculate Each Account's Contribution Margin
Account contribution margin = (account fee revenue − all attributable delivery costs) ÷ account fee revenue. Track production labor, account-management labor, contractors, and client-specific tools separately. Use actual hours, not budgeted hours. The amount left helps cover overhead; it is not net profit.[6][7]
Use the same loaded-cost method across accounts. Include salary, employer taxes, and benefits, but keep agency overhead separate. Tag unbilled scope and rework within the same time entry so you do not count labor twice.[4][6][8]
Compare 2 Hypothetical $10,000 Accounts
Both accounts use a $60 loaded hourly cost and $800 in contractor and tool costs.[6][2]
Metric Account A Account B Monthly fee revenue $10,000 $10,000 Delivery hours, including account management 70 110 Loaded hourly cost $60 $60 Delivery labor cost $4,200 $6,600 Contractor and tool costs $800 $800 Total delivery cost $5,000 $7,400 Contribution dollars $5,000 $2,600 Contribution margin 50% 26% Account B leaves $2,400 less for overhead because of 40 additional hours of coordination, rebriefing, and unbilled revisions. That does not automatically mean the retainer is too low.[2]
The next question is which hours the work needs and which hours you can cut.
Count Overlooked Delivery Work
Audit a full month of internal meetings, Slack requests, approval follow-ups, and senior review. Charge leadership time to the account it serves. Use each person's loaded cost to reflect the higher cost of senior help. Class repeat AI prompting as production or rework based on why it was needed.[5][8]
Count work caused by approval delays, not idle waiting. Follow-ups, task switching, and rescheduling use team time. Idle waiting is not labor. Give each entry 1 activity code and 1 scope or rework tag to show where margin goes without counting work twice.[5][4][8]
Find the Bottlenecks Behind Falling Margins
Falling margins can come from coordination work, unpaid scope, approval delays, or pricing that does not cover delivery costs. To find the cause, compare account-management time, actual delivery hours, and priced hours before changing fees or adding staff, then fix the work that drains the most team capacity.
Separate Account-Management Overload From Scope Creep
Account-management overload is coordination labor. Scope creep is unpaid extra work. Both cut contribution margin, but they need different fixes.
Coordination hours eat into margin even when fee revenue stays flat. Track accounts per manager and account-management hours per account. Use 4–8 accounts per manager as a starting point, not a firm limit. Account complexity still matters.[7]
Compare actual delivery hours with priced hours over the last 3 months. Track unpaid scope hours on their own. Also track revision hours as a share of production hours.[2]
More management time with stable scope points to a coordination problem. More production time tied to extra requests points to weak scope controls.[2]
Track Repeated AI Briefing and Approval Delays
When scope is stable, check how much time goes into briefing AI tools and waiting for approvals. AI is not always the bottleneck. Missing client context can be.
Each time someone rebuilds a client brief, that prep becomes more delivery labor. It leaves less time to handle accounts. Track brief-prep minutes per task and rework hours caused by context errors as separate measures.[9]
Check who owns each approval and which tasks need senior review. Measure the time from submission to decision. Track follow-up, revision, and senior hours per account, too.[9]
A long approval cycle shows a delay. Follow-up and rework hours show what that delay costs in team time.[9]
Separate Pricing Problems From Workflow Problems
Match the fix to the cause before changing prices. Compare contribution margin with scope variance, coordination time, and the mix of staff doing the work.[2]
If delivery runs well but contribution stays low, pricing may be the problem. If revisions pile up or senior staff handle routine tasks, check the workflow first. The goal is more contribution margin without more hires.[2]
| Diagnostic signal | Likely cause | Metric to check | Targeted remedy |
|---|---|---|---|
| Low margin, high utilization | Underpricing | Gross margin % | Reprice or cut scope. |
| High revisions | Weak scope controls or unclear briefs | Revision hours ÷ production hours; unbilled scope hours | Set revision limits and approve extras. |
| High coordination time | Account-management overload | Account-management hours per account | Cut duplicate reporting and clarify handoffs. |
| Context errors | Missing client context | Brief-prep time; context-related rework hours | Use a shared client context and briefing format. |
| Senior time on routine work | Task-assignment imbalance | Utilization by role; senior hours by task | Move routine work to the right role and keep 1 senior review step. |
Increase Delivery Capacity and Measure Profit
Increase delivery capacity by fixing how client context moves through the team, then test the change against margin and quality. More accounts per person improve profit only when delivery costs fall or the team earns more profitable revenue without adding staff or letting quality slip.
Saved time is capacity, not profit. Change the workflow before changing the software stack.
Standardize Client Context, Scope, and Approval
Start with the gaps already found: briefing errors, repeat revisions, and slow approvals. These gaps point to missing context, not just a need for better AI tools.
At kickoff, keep strategy, scope, and approval rules in 1 controlled source.[8][9] Use brief and status templates. Set a clear update schedule, revision limits, and rules for change orders.[9][4][8]
Add 1 internal review to catch work that misses the brief.[9][4][8] Name the final approver by person, not role, so feedback has a clear endpoint.[10]
Test the New Delivery Process on One Service
Test 1 recurring service before changing the rest of delivery.[5][10] Keep the same method for tracking contribution margin by account. Use a standard intake form and set the approval threshold work must meet before production starts.[2][10]
The test should answer a clear question: Can the team carry more accounts per person without cutting contribution margin or quality?
Track where saved hours go. Do they become billable work, or does the team have unused time?[4] Count all pilot costs, including labor and the time and cost to put the new process in place.[5][2]
Conclusion: Confirm Capacity Gains Improve Profit
Compare the baseline with a 60–90-day pilot. Focus on project margin, not just total revenue.[4][8] Include onboarding, setup, and recurring overhead costs in the results.[5][2]
Use the results to check which bottleneck changed.
| Metric | Before: baseline | After: pilot |
|---|---|---|
| Per-client contribution margin | Contribution dollars and % by client | Same measure, including pilot costs |
| Gross margin | Revenue less delivery costs, as % | Same cost classification |
| Management hours | Hours per account per month | Same measure |
| Unbilled hours and rework | Track each separately | Compare hours and share of delivery time |
| Approval time | Time from submission to decision | Same approval stages |
| Senior involvement | Senior hours per account | Same measure |
| Quality | First-pass acceptance; client escalations | Same checks and definitions |
Keep 3 priorities in view: use the same margin definitions, count all delivery costs tied to the work, and expand only when the results support it.
The change must free capacity without hiring, cut costs or support more profitable revenue, and keep quality steady. Saved salaried hours do not automatically become operating profit.
FAQs
How should owner compensation affect my agency’s margins?
Treat owner compensation as overhead, not a direct delivery cost. Like leadership pay, admin costs, and other operating expenses, it reduces your agency’s net profit.
To keep a 15% to 25% net profit margin, count your pay in your overhead budget, typically 30% to 40% of revenue. Leave it out, and profit can look higher than it is. That can leave too little cash to run or grow the agency.
When should I reprice an unprofitable client account?
Reprice or cut scope when account data shows a pattern of low returns, such as gross margin below 50%–55% [1]. Check whether actual hours, labor costs, or tool costs exceed what you built into the fee [1][2][3].
A price change may make sense when client usage shifts, scope grows without a fee change, or delivery costs rise. If the client won't accept a higher price, offer less work for the current fee or end the relationship [1][2][3].
How can I tell if saved delivery time justifies another client?
Compare planned and actual hours for each role. Then calculate each account’s gross margin. Check that time saved with AI isn’t going into work you don’t bill for.
If work keeps taking more hours than you sold, there’s a scope or estimate gap. That’s not spare capacity.
Take on another client only after you close that gap and reach 50–60% gross margin or higher. At 70–85% utilization, your team is near the limit it can maintain. Fix wasted time in delivery first, so added work doesn’t cut margins or burn out the team.