Killing Manual Reporting Forever: The 4-Layer Stack We Deploy
Killing Manual Reporting Forever: The 4-Layer Stack We Deploy
Most reporting work should not exist in human hands. If your team still exports CSVs, fixes spreadsheet dates, and rebuilds decks every week, the issue is not effort. It is the setup.
I see 1 clear lesson in this piece: put every metric on 1 path.
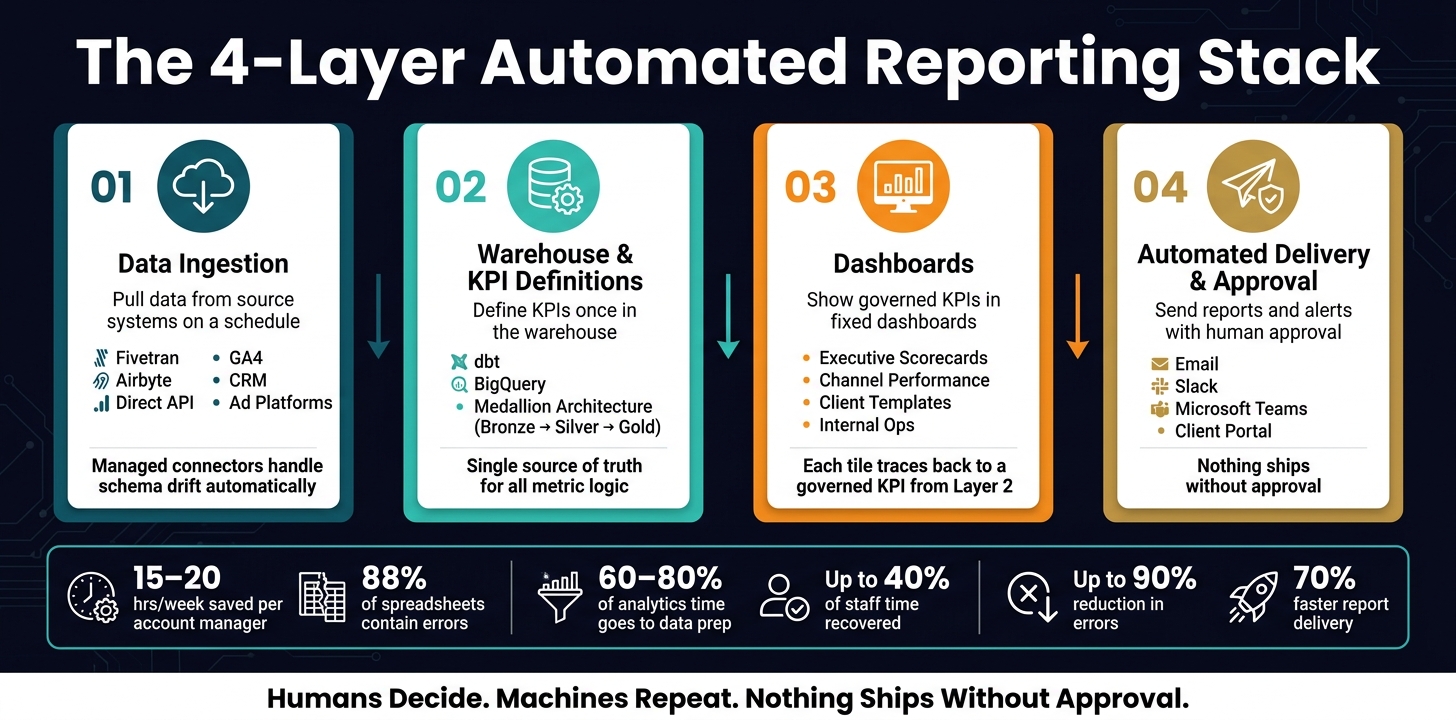
That path has 4 parts:
- Layer 1: pull data from source systems on a schedule
- Layer 2: define KPIs once in the warehouse
- Layer 3: show those KPIs in fixed dashboards
- Layer 4: send reports and alerts with approval before anything goes out
The numbers make the case fast:
- Manual reporting can eat 15 to 20 hours per week per account manager
- A single report can take 3 to 4 hours
- 60% to 80% of analytics time can go to data prep and reporting
- 88% of spreadsheets contain errors
- Teams that move to this setup can win back up to 40% of staff time, cut errors by up to 90%, and send reports about 70% faster
This is the same frame AGL uses with Tango.
Humans decide. Machines repeat. Nothing ships without approval.
If you run marketing for several clients, that is the shift: stop scaling reports with more people. Scale them with 1 fixed system.
What I’d take from this article is simple:
- Put raw data in 1 place
- Set KPI logic 1 time
- Reuse 1 set of dashboards
- Add approval before client delivery
That is how AGL runs many marketing departments with a small team. More output. Less admin work. No AI stack to babysit.
Your next move: pick 1 client metric, map it across all 4 layers, and add the approval gate before it goes out.
The 4-Layer Automated Reporting Stack: From Raw Data to Client Delivery
Layer 1 and Layer 2: Data collection, warehousing, and metric definitions
Most agencies do not have a reporting problem first. They have a system problem first.
The shift is simple. When one team runs marketing for many clients, reports cannot live in tools, tabs, and one-off fixes. They need to live in a setup that repeats. That is how AGL runs many marketing departments with a small team using Tango. Humans decide. Machines repeat. Nothing ships without approval.
Layer 1: Connectors and data ingestion from source systems
Layer 1 pulls raw data from each source into 1 warehouse on its own. For SaaS, that often means billing, CRM, ads, and product analytics. For agencies, it usually means ad platforms plus GA4.
The big choice here is how you pull the data.
Managed connectors like Fivetran or Airbyte are the best default for most sources. They deal with schema drift, like new fields or changed data types, so pipelines keep running. Direct API pulls give you more control. But each API change adds work. In-app reporting is fast at the start, but the data stays stuck in each tool.
| Method | Setup Time | Reliability | Control | Maintenance Burden |
|---|---|---|---|---|
| Direct API Pulls | High | Low | Total | High |
| Managed Connectors | Low | High | Medium | Low |
| In-App Reporting | Zero | Medium | None | Zero |
This is where many agency teams lose time. A tool works fine for 1 client. Then you add 10 more. Then 20. Now your team is checking broken pulls, odd field changes, and mismatched numbers.
Tango fixes that by making repeat work repeatable. AGL uses that same frame to keep output high without building a giant AI stack to manage. The machine does the same task the same way. The team stays in control.
But stable ingestion is only the first step. After data lands, you still need 1 clear meaning for each KPI.
Layer 2: Warehouse setup and KPI definitions
Layer 2 turns raw data into governed metrics.
With a tool like dbt, you define MRR, CAC, ROAS, churn, SQLs, and active users once in SQL or YAML. Then every dashboard uses that same definition. That is what stops spreadsheet drift.
A clean Layer 2 uses a Medallion Architecture. Raw data lands in Bronze. It gets cleaned in Silver. Then it gets rolled up into Gold, where business-ready KPI records live.
Each metric should have:
- A clear owner
- A freshness SLA
- Version control in a Git repository
That setup gives you a full audit trail for any logic change. For agencies, separate schemas for each client in the warehouse, like BigQuery datasets, keep data private and stop cross-client leakage.
This is the part that changes delivery. Once metric logic sits in code, your team does not have to rebuild the same logic by hand for each account. You make the rule once. Then Tango helps the team repeat the process with review in place.
Warehouse-centric vs. connector-centric setups: when to use each
Not every team needs a full warehouse on day 1.
A connector-centric setup gets you live fast. It works well for small teams with simple reporting. But it starts to crack under volume. Logic gets buried inside black-box tools. Audits get hard as account count grows.
A warehouse-centric setup takes more time to launch. But it pulls data into a cloud warehouse, keeps logic in version-controlled SQL, and lets you reuse the same dbt model templates across client schemas instead of rebuilding logic each time.
| Feature | Connector-Centric | Warehouse-Centric |
|---|---|---|
| Scalability | Low - slows with volume | High - built for scale |
| Auditability | Difficult - logic is hidden | Full - SQL-based history |
| Speed to Launch | Very fast | Moderate |
| Multi-Client Fit | Good for small, simple accounts | Best for complex, data-heavy clients |
| Data Retention | Limited by source API | Permanent/Historical |
Use a connector-centric start for simple reporting. Move to a warehouse-centric model when KPI logic must be shared across clients or teams.
That is the lesson here. Do not scale reporting with more manual work. Scale it with shared logic.
AGL’s model is built on that idea. A small team can run many client marketing departments when the system repeats cleanly, the data stays in 1 place, and every output gets checked before it goes out.
If your reporting stack still depends on hidden tool logic or manual fixes, start with 1 move: put your KPI definitions in the warehouse and make them the single source your team uses.
sbb-itb-9cd970b
Layer 3 and Layer 4: Dashboards, report templates, and automated delivery
Most agencies do not have a reporting problem. They have a delivery problem.
The data may be right in the warehouse. But if no 1 can see it fast, trust it, or send it without rework, the team still burns hours each week. That is where Layer 3 and Layer 4 matter.
Layer 2 sets the truth. Layer 3 shows it. Layer 4 sends it. This is also how AGL runs many marketing departments with a small team using Tango. Humans decide. Machines repeat. Nothing ships without approval.
Layer 3: Dashboards and reporting surfaces people actually use
Layer 3 is not about making every chart you could make.
It is about building the reporting views your team keeps rebuilding on a set cycle. That is the lesson here. Do less. Make the right dashboards. Use them again and again.
A clean Layer 3 setup usually covers 4 dashboard types.
- Executive scorecards show 10 to 15 metrics like ARR, net revenue retention, CAC, LTV, and churn, with filters for segment-level views.
- Channel performance dashboards show spend, clicks, conversions, CAC, and ROAS by channel and campaign, refreshed daily from the warehouse.
- Client reporting templates give agencies 1 governed layout for each service line, where account managers add commentary, not numbers.
- Internal operating dashboards support the weekly check-ins ops, support, and finance teams run on their own schedules.
Each tile should map back to a governed KPI from Layer 2.
That means each number can be traced back to its source table. If some 1 challenges a figure, you can drill from the dashboard to the exact model. That is how trust is built.
Keep the live dashboard set small.
Give each dashboard a clear owner and a clear use case. Let people test ideas in a sandbox. But that sandbox should never go external.
At AGL, this is a core part of the Tango system. The team does not rebuild reports for each client from scratch. Tango keeps the reporting surface fixed, so the team can spend time on the note, the call, and the next move.
Once the dashboard becomes the source of truth, the next step is simple. Send it without manual chasing.
Layer 4: Scheduled delivery, alerts, and approval steps
Layer 4 moves reporting from manual pull to automatic send.
Instead of waiting for a stakeholder to log into a BI tool, the system sends the data where they already work. That might be email, Slack, Microsoft Teams, or a client portal.
Weekly performance recaps can go out by email or in a Slack channel like #client-[name] on a fixed schedule.
Monthly executive scorecards and client review packs can include automated data and still leave room for human commentary before they go out. That last part matters. Data alone is not the report. The human read is.
Alerts for metric breaches are where this layer starts to pay off fast.
If conversion rate drops more than 20% versus the trailing 7-day average, or CAC moves above its target threshold, the system can fire an alert with context. That should include the metric, the baseline, the threshold breached, and a direct link to the right dashboard.
For client work, delivery should end with review.
It should not end with a raw export. For board packs and major client reports, Layer 4 adds an approval step. The system builds the draft, then routes it to a data lead or account owner for sign-off before anything goes external.
Each approval is logged with reviewer, time, and data state.
That is the Tango frame in plain terms. Machines assemble and route. People review and approve. Nothing ships without approval.
Manual vs. semi-automated vs. fully automated reporting: what changes at each level
As the stack matures, the delivery model changes too.
The shift is not just about speed. It changes labor, error risk, and how many clients 1 operator can manage. That is a big reason AGL can run many marketing departments with a small team through Tango.
| Feature | Manual | Semi-Automated | Fully Automated |
|---|---|---|---|
| Time Spent per Reporting Cycle | 5–10 hours/week | 1–2 hours/week | <15 minutes/week |
| Error Risk | High - copy-paste errors | Medium - manual assembly of auto-pulled data | Low - governed warehouse logic |
| Turnaround Speed | Days or weeks | Hours | Instant / scheduled |
| Clients per operator | Low - more clients need more staff | Moderate - staff manages templates | High - 1 person manages many clients |
Manual reporting assembles data.
Automated reporting governs it, sends it, and keeps the team focused on exceptions. That is the clear lesson. When the system handles repeat work, the team can handle judgment.
If you want the same payoff AGL gets from Tango, start with 1 move: pick the 4 reporting surfaces your team rebuilds most often, govern them in Layer 3, then add approval-based delivery in Layer 4.
How the full stack runs in B2B SaaS and agency operations
Here’s the part most agencies miss: reporting does not break because the chart is wrong. It breaks because a metric has no set path from source to client. Once that path is fixed, a small team can run a lot more accounts with less mess.
The lesson is simple. One metric needs one system. That system starts at the source, moves through clean logic, shows up in a dashboard, and ends in a client-ready update. That is how AGL runs many marketing departments with a small team using Tango.
Example flow: from source metric to delivered report
Take paid pipeline as the metric. Here is the full flow in 1 client-ready example.
Layer 1 pulls raw data from Google Ads (campaign_name, cost, clicks, conversions) and Salesforce (opportunity_id, amount, stage, lead_source) through managed connectors like Fivetran or Airbyte.
Layer 2 joins those tables using a dbt model that produces a clean fct_marketing_pipeline table. cost_per_opportunity and pipeline_ROAS are calculated once, tested, and documented.
Layer 3 exposes that model in a Paid Pipeline Performance dashboard with tiles for pipeline value by channel, cost per opportunity by campaign, and weekly ROAS trends. Filters let account managers slice by client, date, or geography.
Layer 4 sends a Monday, 8:00 AM email digest to account managers and clients with last week’s results. A separate Slack alert fires on its own if cost_per_opportunity goes above $800 for 3 straight days, with a direct link to the right dashboard tile. No manual pull. No manual formula.
That’s the point. Humans decide. Machines repeat. The team does not rebuild the same report each week.
Who owns each layer: roles, SLAs, and approval workflows
A stack only keeps running when each layer has a clear owner and SLA. If no one owns the handoff, small issues turn into client problems fast.
| Layer | Owner | Key Responsibility | Practical SLA |
|---|---|---|---|
| Layer 1: Ingestion | Data Engineer / Ops | Source-to-warehouse data syncs | Sync success rate >99%; all sources refreshed by 7:00 AM daily |
| Layer 2: Warehouse | Analytics Engineer | KPI model logic and data quality tests | Schema incidents resolved within 24 hours |
| Layer 3: Dashboards | BI Analyst / RevOps | Dashboard accuracy and QA | Review minutes per new dashboard or report tracked monthly |
| Layer 4: Delivery | Account Manager / Growth Lead | Final approval and client communication | Report open rate monitored per digest |
When a connector fails, Data Engineering owns the fix and shares the impact with stakeholders. When a dashboard number looks off, the BI Analyst checks it against the source model before anyone escalates. When a client-facing report is ready, the Account Manager reviews the story and approves it.
Nothing ships without approval.
That is what turns a reporting stack into fewer manual hours, fewer client errors, and stronger delivery.
How Agile Growth Labs uses Tango to run reporting with fewer people
Once ownership is clear, Tango pushes the same process every time. That matters more than most agency owners think. The win is not just speed. The win is that the team does not have to babysit an AI stack or rely on memory.
Agile Growth Labs uses Tango as the workflow layer over all 4 technical layers. When a new client account is onboarded, AGL applies 1 template across clients that covers connector setup, KPI model checks, dashboard build, and weekly digest setup. Each task has a clear owner, a QA checklist, and an approval gate.
A human reviews data and narrative before any output becomes client-facing. Nothing ships without approval.
That is how a small team runs more client accounts without adding ad hoc reporting work.
If you want stronger delivery with less manual lift, map 1 client metric through all 4 layers in Tango and add the approval gate before anything goes out.
How to deploy the stack without overbuilding it
Start with one layer, then build as complexity grows
Most agencies don’t need a big data stack on day 1. They need 1 reporting loop that works.
That’s the shift. Don’t map the whole stack first. Build one small system. Prove it in one account. Then roll it out in phases.
Start with the smallest complete workflow:
- 1 reliable connector
- 1 warehouse
- 1 executive dashboard built around 1 high-value metric: MRR
When that first loop is stable, lock KPI definitions in a shared metrics layer. That way, the same definitions run every dashboard.
This order matters. It keeps shaky data out of automation. Then, after 1 stable quarter, turn on automated delivery and alerting.
For $1M–$50M ARR SaaS teams and 5–50 person agencies, this is the rule that works in practice: prove 1 repeatable reporting loop first. Then add more sources, more audiences, and more automation as reporting volume grows.
That’s also how AGL runs many marketing departments with a small team using Tango. Humans decide. Machines repeat. Nothing ships without approval. The result is more output without a pile of tools to manage.
Start small. Stabilize. Then automate.
Lean, mid-range, and advanced stack configurations
Use the table below to match stack depth to reporting complexity.
| Stack Level | Best Fit | Stack Depth | Governance | Automation Level |
|---|---|---|---|---|
| Lean | $1M–$5M ARR SaaS / 5–15 person agency | 1 connector, 1 warehouse, 1 dashboard (e.g., Looker Studio or Metabase) | Founder-led definitions, ad-hoc logic in the dashboard | Manual refreshes or basic email schedules |
| Mid-Range | $5M–$20M ARR SaaS / 15–50 person agency | ELT (Fivetran/Airbyte) + warehouse + dbt + BI tool | Centralized shared metrics layer; version-controlled SQL | Scheduled Slack/email delivery; automated executive digests |
| Advanced | $20M–$50M+ ARR SaaS / 30–50 person agency | Full 4-layer stack, with optional add-ons as needed | Strict data contracts; automated quality checks; centralized Data Ops | Real-time alerts, CRM actions triggered by data, automated approval workflows |
Key takeaways
Manual reporting breaks at the handoffs. The 4-layer stack cuts those handoffs by standardizing ingestion, metrics, dashboards, and delivery.
Teams that deploy it ship reporting faster, with fewer errors, and with far less labor than spreadsheet-driven workflows.[1]
The point is not to pile up tools. The point is to build 1 repeatable system that gets stronger over time.
That’s the lesson AGL applies with Tango. Build the loop. Keep humans in control. Let machines handle the repeat work. Then add the next layer only when the current one is stable and the next bottleneck is real.
If you want that kind of output without building an AI stack to babysit, the next move is simple: look at your current reporting loop and cut it down to the smallest version that can run cleanly.
FAQs
Which layer should we build first?
Start with a simple fact: most agency reporting problems are not dashboard problems. They’re data asset problems.
At AGL, that lesson shaped the Tango system. We audit the data first. We map where it lives, who owns it, what blocks access, and what the client wants the data to do. That’s how a small team can run many marketing departments without extra tool sprawl. Humans decide. Machines repeat. Nothing ships without approval.
So begin with a full audit of your data assets. Look at where the data sits, how easy it is to reach, your biggest bottlenecks, and your main business goals.
Once your data touchpoints and ownership are clear, build the base layer first. That means clean, easy-to-reach, governed data. That base comes before every report, dashboard, and client view.
If you want stronger delivery with less busywork, use the Tango rule here: fix the source before you dress up the output.
How do we choose between a lean and advanced stack?
A lot of agencies don’t have a tool problem. They have a stack drag problem.
The shift is simple. You should choose your setup based on your data maturity, your bottlenecks, your budget, and your team’s capacity.
A diagnostic like the Marketing Stack Complexity Index can help. It shows integration debt, tool overlap, and data silos. If you score above 26, your stack may cost more to maintain than it gives back.
Start with a lean stack when you need clean naming, stable pipelines, and fewer manual bottlenecks. That’s how AGL runs many marketing departments with a small team through Tango. Humans decide. Machines repeat. Nothing ships without approval.
Move to an advanced stack when you scale and need more room for APIs, modular tools, and heavier workflows. The point is not more software. The point is more output without giving your team another AI stack to babysit.
If you want to make the call fast, score your stack first. Then map the next move inside the Tango system.
What approval step should happen before reports go out?
Before a report leaves your team, one thing matters most.
The data has to be clean.
That sounds simple. But for agencies that manage many client accounts, this is where trust is won or lost. A sharp report with bad inputs is still a bad report.
Your team should run a full data audit before anything goes out. Clean and standardize records. Check for duplicates. Fill in missing fields. Make sure formatting stays the same across the dataset.
This is a core part of the Tango system at AGL. Humans decide. Machines repeat. And nothing ships without approval.
Those quality checks sit inside your governance process for a reason. They help make sure the data is solid before final output. That cuts errors and keeps automated delivery worth trusting.