
Data Is the Distribution. Distribution Is the Survival.
If your product can be copied in 60–90 days, your data is what keeps growth alive.
I’d sum up the article like this: SaaS and AI companies win when they use first-party product data, workflow data, revenue data, and AI interaction history to drive acquisition, retention, and expansion. When that data flows into sales, marketing, and customer success, teams often see lower CAC, faster payback, and stronger NRR.
Here’s the core idea in plain English:
- Products are easier to copy now.
- Owned data is harder to copy.
- Live usage data beats static lists.
- The best growth loops come from product behavior, not just ads or cold outreach.
- The goal is simple: connect signals from product, CRM, billing, and support, then act on them fast.
A few facts stand out:
- Feature parity has dropped from 12–18 months to 60–90 days
- Some AI-native firms run at 80%+ gross margins
- Some price 50–70% lower than older vendors
- In some cases, regulated-market compliance can create 12–24 months of separation
- 81% of B2B buyers speak with the winning vendor first
What I take from this is simple: data is no longer just a product input. It is how a company gets chosen, keeps users, and grows accounts over time.
The article then breaks that idea into four parts:
- Which data assets matter most
- How data turns into growth
- What stack connects and activates that data
- What founders and GTM teams should do in the next 90 days and 12 months
Bottom line: the firms that own the usage loop, the workflow, and the customer context are in a much better spot than firms that rely on paid distribution alone.
From Startup to 100M ARR | A Data-Driven Path to Scalable Growth with Sigma
sbb-itb-9cd970b
The Data Moat: Which Data Assets Actually Create Distribution Power
Not all data gives you distribution power. Four types matter, and they only matter when they change how a company wins customers, keeps them, or grows each account.
The 4 Data Assets That Matter Most
Customer and proprietary firmographic data includes transaction histories and industry-specific records that can't be rebuilt from public sources or bought from commodity lists. This kind of data helps with acquisition because it gives sales and marketing teams signals that generic lists simply don't have.
Event-level usage data is more useful than raw clicks and page views, which are often weak signals. The part that matters is the sequence of actions that points to an upgrade or churn. Behavioral patterns predict customer outcomes far better than raw traffic data [2]. And the distribution impact is straightforward: better prediction leads to sharper retention and expansion plays.
Workflow and process data is the stickiest asset of the bunch. When your product becomes the system of record for a regulated or messy workflow, switching out isn't simple. A customer has to re-validate compliance trails and retrain staff [1]. That's why the strongest data moats are built into the product itself, not added later like an afterthought.
AI interaction data - prompts, outputs, corrections, and feedback - is growing fast. Each correction helps the model get better and makes it more useful for that customer [2]. Over time, that creates retention that builds with every interaction.
High-Value Data vs. Low-Value Data
Here's the plain test: if a competitor can buy or scrape the same data, it isn't a moat.
Data gets its power from repeatable distribution advantage, not from sitting in storage. High-value data works like a flow, not a stock. Every new customer interaction adds to it and improves it, which makes the product better for the next user [1].
| Data Type | Value Level | Why It Matters for Distribution |
|---|---|---|
| Proprietary usage loops | High | Generated by product interactions that are hard for others to copy |
| Workflow / system of record | High | Creates switching costs at the team and process level |
| AI prompts and feedback | High | The model gets better with each interaction, which strengthens retention |
| Licensed or third-party lists | Low | Commodity data that can be bought or scraped |
U.S. Compliance and Infrastructure Basics
Before data can help distribution, the basic stack has to be there. That means event tracking, a clean CRM, identity resolution, and a warehouse or CDP.
In regulated markets, SOC 2, HIPAA, and FedRAMP can create 12–24 months of defensibility [3]. That matters because compliance can block rivals, shorten sales cycles, and protect access to regulated markets. In other words, it's a growth constraint, not just a legal sidebar. More than half of B2B buyers now ask about training data, privacy, and security before they buy [4].
Once that stack is in place, the job shifts from collecting data to turning it into a repeatable growth motion.
How Data Becomes Distribution: The Core Growth Models
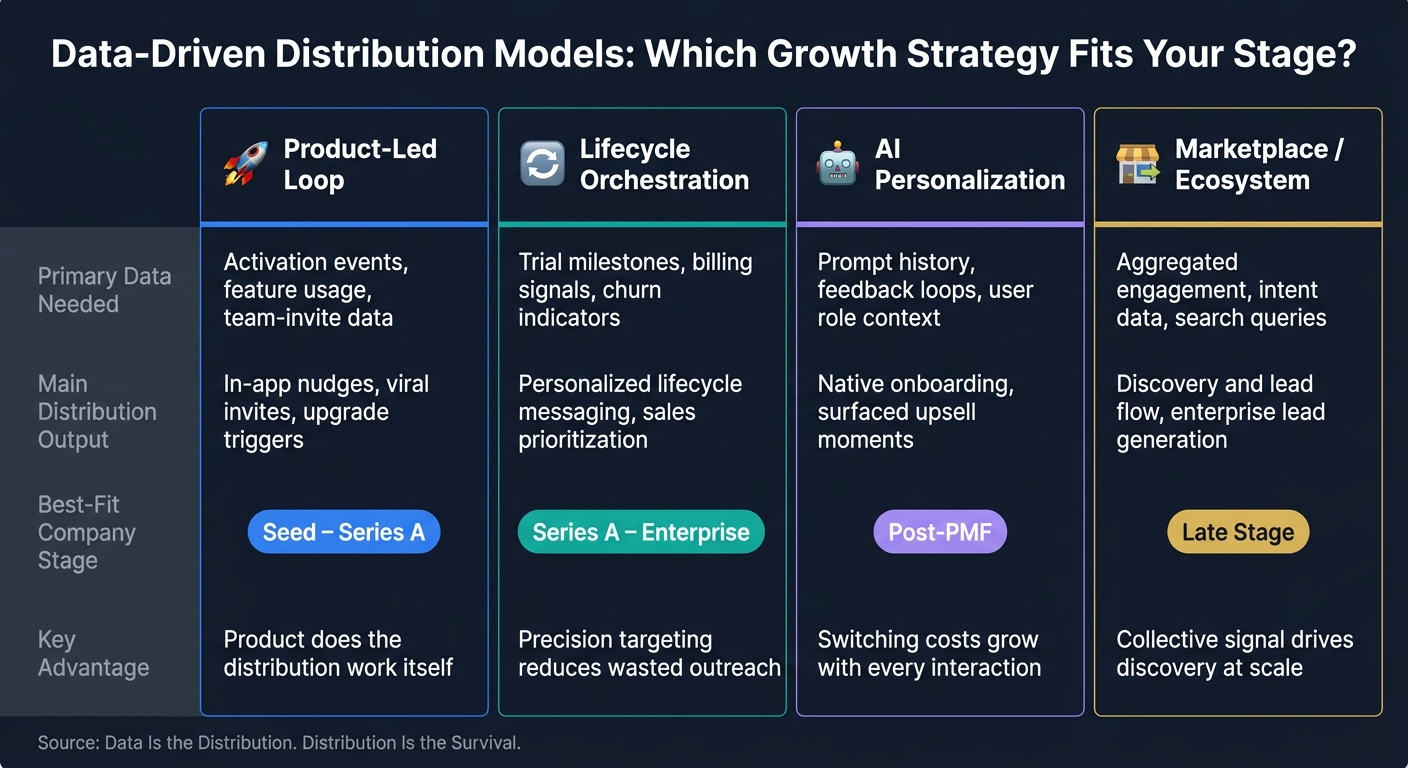
Data-Driven Distribution Models: Which Growth Strategy Fits Your Stage?
Once signals are connected, distribution turns into a timing problem. The key is simple: act when intent is highest. There are four main models here, and each fits a different company stage.
Product-Led and Lifecycle Growth Driven by Usage Data
Product signals can trigger the next best move right when a user is ready for it. That might mean an invite prompt, a trial nudge, or an upgrade message shown at the moment of intent. Done well, this cuts reliance on paid acquisition because the product starts doing the distribution work itself.
Billing signals, invite activity, and usage limits also help teams focus on the accounts most likely to expand or churn. That means less wasted outreach and tighter prioritization.
Lifecycle orchestration takes this a step further. Instead of looking at single events in isolation, it layers behavioral sequences on top of basic event data. That matters. A lone click can be noisy. A pattern of actions tells a much clearer story. Companies that instrument for sequences, not just isolated events, can reach the right accounts at the right time, and that precision builds month after month.
AI Distribution Powered by Interaction and Workflow Data
AI products have a different edge. When they capture role, team, and task context, they can place upsells directly inside the workflow. The engine behind that is owned interaction history: prompts, corrections, and workflows the system records and compounds over time.
As the product learns from use, users have more reason to stay. The product gets better the more it is used, and switching costs climb with it. When AI systems understand role, team, and workflow context, they can also surface onboarding steps and upsell moments inside the product instead of pushing them from the outside.
These models vary by signal, action, and maturity.
Comparison Table: The Main Data-Driven Distribution Models
The table below shows how signal, action, and company stage change by model.
| Growth Model | Primary Data Needed | Main Distribution Output | Best-fit Company Stage |
|---|---|---|---|
| Product-led Loop | Activation events, feature usage, team-invite data | In-app nudges, viral invites, upgrade triggers | Seed–Series A |
| Lifecycle Orchestration | Trial milestones, billing signals, churn indicators | Personalized lifecycle messaging, sales prioritization | Series A–Enterprise |
| AI Personalization | Prompt history, feedback loops, user role context | Native onboarding, surfaced upsell moments | Post-PMF |
| Marketplace / Ecosystem | Aggregated engagement, intent data, search queries | Discovery and lead flow, enterprise lead generation | Late Stage |
The marketplace model plays by different rules. At scale, aggregated engagement and intent data from a directory can support discovery, waitlist growth, and enterprise lead generation. In that setup, distribution comes from collective signal, not just from one person’s product usage.
"Distribution is not a 'growth channel.' It is your survival system." - Miqdad Jaffer, Product Lead at OpenAI [7]
Each model runs on different inputs, but the rule stays the same: capture the signal first, then act on it fast.
Building the Data Spine: Capture, Enrich, Connect, and Activate
Capture the Right Customer, Product, and Revenue Signals
Track fewer signals, and focus on the ones tied to activation, expansion, or churn. More data doesn't help if nobody knows what to do with it. The fix is a tighter set of signals with clear action paths. That only works when those signals map back to a clean identity and account model.
Capture, enrich, connect, and activate is the operating system behind defensible distribution.
Start with the events that matter most: sign-ups, activation steps, feature use, workflow signals, and user feedback. Keep the schema simple enough that Engineering and GTM can use it without needing a translator. If your sales team can't explain what an event means, it won't get acted on.
Go beyond standard events and put extra weight on zero-party data - information users share on purpose, like stated preferences or profile completion during onboarding. This data is more useful than inferred behavior [5]. You should also plan for correction signals: when a user edits an AI output, rejects a recommendation, or rates a result. That feedback is some of the strongest data you can own [8].
Enrich and Connect Data Across Systems
Once you've captured the right events, enrichment turns behavior into account-level intent. It adds firmographic context so routing and scoring can happen in a way teams can use, with tools like Clay, Clearbit, or 6sense.
The next step is connecting data across systems. CRM, billing, product, support, and warehouse data need to work together so every team sees one customer record.
The setup that makes this possible is warehouse-native. Your cloud data warehouse - Snowflake, BigQuery, or Databricks - becomes the single source of truth. Use the warehouse as the system of truth, then sync modeled data into operational tools with reverse ETL. Reverse ETL tools push modeled data into CRM and marketing systems, which can cut campaign setup time in a major way [10]. That's how data stops being just reporting and starts driving distribution.
Activation Plan and Data Lifecycle Table
The last step is simple in theory and hard in practice: route each signal to the person and workflow that can do something with it. The table below shows how each stage of the data lifecycle maps to tasks, tools, and owners.
| Stage | Main Tasks | Typical Tools | Primary GTM Owners |
|---|---|---|---|
| Capture | Track sign-ups, activation events, feature use, user feedback | Segment, Amplitude, PostHog | Product & Engineering |
| Store | Centralize raw events and interaction logs into a canonical source of truth | Snowflake, BigQuery, Databricks | Data Engineering |
| Enrich | Layer in firmographics, technographics, account ownership, lifecycle stage | Clay, Clearbit, 6sense | RevOps & Marketing |
| Activate | Push signals to CRM, trigger automated plays, power AI agents and scoring | Hightouch, Census, Salesforce, HubSpot, Braze | Sales, CS & Marketing |
Each stage exists for one reason: get the right signal to the right owner fast.
Activation is where many teams get stuck. Data sits in the warehouse, but it never makes its way to the rep or the lifecycle campaign. The practical fix is to define one trigger per lifecycle stage - a specific signal that automatically routes an account to the right owner or workflow. For example, when a trial account hits your activation threshold, it routes to an SDR. When an active account stops using a core feature, it triggers a customer success sequence.
For directory-style products, traffic and engagement data can also feed lead-gen and enterprise routing workflows.
"The moat is not what you know about your customers. It is what your system learns about them – over time, with their trust, through interactions that your architecture is designed to compound." - Rohit Prabhakar, Fortune 50 CMO and CDO [5]
Playbook and Conclusion: Turning Data Into Long-Term Survival
What HubSpot, Salesforce, and OpenAI Show About Data-Driven Distribution
You can see this playbook most clearly in companies that turned data into part of the day-to-day workflow.
Salesforce holds a valuation above $300 billion and NRR above 120% [9] because it became the system of record for revenue data across 150,000 enterprise customers. That position is hard to dislodge. Replacing Salesforce doesn't just mean swapping one tool for another. It means rebuilding the systems tied to revenue, finance, procurement, and reporting [9].
HubSpot followed a different route. It built and owned the "Inbound" category, then expanded that position with a marketplace of more than 2,600 apps. That pulled the product deeper into daily work across teams [4][6]. And timing matters here: 81% of B2B buyers speak with the winning vendor first [4]. If you're the first platform they trust, you're already a step ahead.
OpenAI is moving in a similar direction. As inference costs fall, proprietary interaction data starts to matter more than the model alone. That's where the edge shifts. Proprietary data can materially improve model performance, especially when behavioral context is included [2].
A 90-Day and 12-Month Roadmap for Founders and GTM Leaders
Those patterns point to a simple build order.
- Audit signals. Figure out which data you actually own: usage loops, workflow records, and interaction history. Then separate that from data you license or scrape. If a competitor can buy the same dataset, it isn't a moat.
- Clean CRM and instrument events. Fix identity resolution. Track behavioral sequences, not just one-off clicks. If your sales team can't explain what an event means, nobody will act on it.
- Connect systems. Bring usage, revenue, and support data into one source of truth. Use reverse ETL to send modeled data back into CRM and marketing tools so each team works from the same record.
- Automate triggers. Set one signal for each lifecycle stage, such as activation threshold, churn risk, or expansion intent. Then route that signal to the right person or workflow automatically.
Every quarter, run a blunt stress test: if a competitor could win your best customer just by rebuilding the product, you still don't have a moat [3].
Conclusion: The Companies That Own the Data Own the Channel
Once a company owns the data layer, its growth motion starts to look different.
Proprietary data is now the main distribution edge, and distribution is what will decide whether a SaaS or AI company survives the next few years. Building software isn't the hard part anymore. The median time to feature parity fell from 12–18 months in 2021 to just 60–90 days in 2026 [3]. The hard part is getting chosen, getting trusted, and becoming part of the customer's workflow.
The data assets that matter most are customer identity data, product usage data, workflow and integration data, and AI interaction data. When a company captures, enriches, and activates that data across product, sales, marketing, and customer success, it builds things competitors can't copy fast: organizational switching costs, compounding model accuracy, and a distribution channel that keeps feeding itself.
Use CAC, LTV, NRR, and payback period as proof that the data engine is compounding.
The companies that own the data own the channel.
FAQs
How do I know if my data is a real moat?
Your data becomes a real moat when it gives you a durable edge that other companies can't copy without a lot of time, money, or luck. In plain English: if rivals can easily buy it, scrape it, or recreate it, it’s probably not much of a moat.
The strongest kind of data usually comes from steady product usage. It gets woven into your workflows, user trust, and distribution, which makes it much harder for someone else to catch up. That’s where things get interesting.
A strong signal is a self-reinforcing flywheel: customer interactions make your product and customer experience better, which leads to more usage, better data, and a larger lead over time.
What should I instrument first in the next 90 days?
Start by instrumenting first-party customer data across the places where people actually interact with your business:
- website analytics
- app usage
- purchase history
- support tickets
- email engagement
- in-product behavioral patterns
This is the base layer. It helps you understand how customers behave, build prediction and connection layers on top, and create a defensible data moat.
The big point here is simple: start early. Even at around $50K ARR, it’s worth putting this in place, because the value compounds over time.
How can a small SaaS or AI team activate data without a huge stack?
Focus on 2–3 golden signals that point to customer success, then spot them as early as you can. From there, set up simple, real-time feedback loops, ship small updates often, and keep a close eye on three things: behavioral data, customer assessments, and relationship patterns.
This works best when you stay close to the signal instead of drowning in noise. You don’t need a giant dashboard packed with metrics. You need a small set of indicators that tell you, fast, whether customers are getting value or drifting away.
LLMs can also help you get more out of small datasets. That matters when you don’t have a huge volume of data to work with but still need useful patterns and sharper reads on what customers are doing.
It also helps to weave your product into the tools and systems people already use. When your product fits into existing workflows, adoption can grow more naturally, without a huge marketing push or a heavy infrastructure stack.